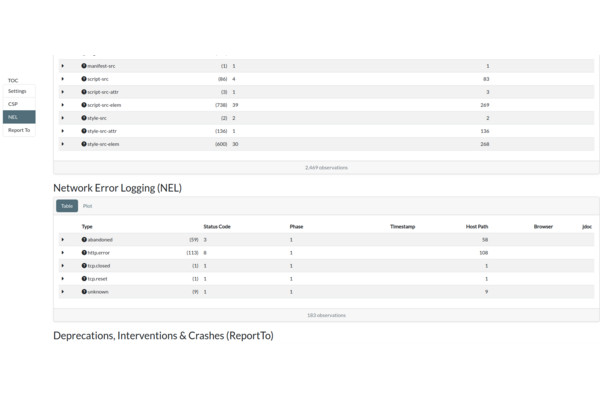
Network Error Logging - Important Insights

This is the second in the series of blog posts about using server headers
- Content Security Policies
- Network Error Logging - this one!
Heads up! We’re about to launch WASP, a Web Application Security Platform. The aim of WASP is to help you manage (well, you guessed it) the security of you application using Content Security Policy and Network Error Logging. We’ll be chatting about it more in a full blog post nearer the time.
What is Network Error Logging?
As this is written, Network Error Logging (NEL) is still an experimental header from W3C. It’s a feature of most browsers that lets a website / application opt in to send reports about failed network fetches from the browser. Its aim is to let us, the developers, know when a user has failed to reach the application. For instance, NEL would have let W3C know that when I visited their Network Error Logging page, I had a 503…

Why do you need Network Error Logging?
Not being able to load your application (shiny, Rmarkdown or quarto for example) due to a network failure is possibly the worst experience a user can have on your website (apart from XSS attacks or similar). To understand these errors, we need support from the browser. Why? Well, this information will never reach the server, rendering the server metrics useless.
Since we are setting Network Error Logging at the server layer, we can gain additional insights into our our application is functioning in real life. This level of detail is particularly important now that we are able to quickly create Shiny dashboards, Rmarkdown & Quarto documents. Once you throw in Posit Connect, you can quickly generate a large amount of web content in a short space of time.
Activating the Report-To header
There are two steps to activating NEL for your site. First, it requires the Report-To header. We chatted a little bit about it’s predecessor, report-uri, in the Content Security Policy blog. The Report-To header allows us to specify groups of endpoints to use within the Content Security Policy and Network Error Logging headers. This means we can send our CSP and NEL reports to different endpoints for separate processing. An example Report-To would look like so
Report-To: {
  "group": "csp-endpoint",
  "max_age": 17280000,
  "endpoints": [
    {
      "url": "https://jumpingrivers.com/csp-reports"
    }
  ]},
  {
  "group": "nel-endpoint",
  "max_age": 17280000,
  "endpoints": [
    {
      "url": "https://jumpingrivers.com/nel-reports"
    }
  ]}
In this set-up, we’ve configured the browser to send reports to the endpoints for 17280000 seconds (200 days). After this, you’ll have to re-issue the Report-To header to begin receiving reports again.
Activating the NEL header
The NEL header is pretty simple. There are only two fields:
report-to: The endpoint group name to send the NEL reportsmax_age: How long the browser should use the endpoint for in seconds.
If we want to send NEL reports to the nel-endpoint group, then my NEL header looks like this
NEL: {
  "report_to": "nel-endpoint",
  "max_age": 17280000
}
The report format
Let’s say we’ve set NEL up on our website. A user trying to access a page on the website has received a 400 error code. The browser will send a POST request of Content-Type: application/reports+json with a format similar to
{
  "age": 15,
  "type": "network-error",
  "url": "https://jumpingrivers.com/example",
  "body": {
    "elapsed_time": 354,
    "method": "POST",
    "phase": "application",
    "protocol": "http/1.1",
    "referrer": "https://jumpingrivers.com/example",
    "sampling_fraction": 1,
    "server_ip": "115.554.22.87",
    "status_code": 400,
    "type": "http.error"
  }
}
The top-level “body” key contains the actual network error report whilst the other top-level keys are meta info about the report. The meta info includes:
age- How long after the error was encountered did the browser send the report? In ms.type- Type of report. Always “network-error” for NEL reports.url- The URL where the error occurred.
Within the body itself, there are a few important keys we should know about:
referrer- This is the URL from which the user has come. If this and the top-levelurlare the same, the error happened whilst the user was on the same page.status_code- The status code that the browser received from the server. In this case, it’s a 400.elapsed_time- How long it took the browser to abort the process after it started, in ms. For us, this is 354ms.type- The type of network error. See a full list of the error types here. We’ve gothttp.error, which means the browser successfully received a response, but it was a 400 or 500 status code.server_ip- The server IP the browser is trying to resolve to.
Note, the report does not get sent as soon as the user gets the network error. The browser will batch reports and send periodically. As well as this, no information is kept about the end-user, just the network error.
Need help setting up Network Logging? Please get in contact.

