
Super early bird tickets for AI in Production 2027 are on sale now.
See all results
items
    • Overview 
    • Join Us  
    • Community 
    • Contact 
    • Overview 
    • Course Catalogue 
    • Public Courses 
    • Overview 
    • Posit 
    • Data Science 
    • Engineering 
    • Blog 
    • Case Studies 
    • R Package Validation 
    • Gallery 
    • diffify  
    • Pro Bono Support 

Creating an animated Christmas tree in R

Authors: Amieroh Abrahams & Osheen MacOscar

Published: December 24, 2024

tags: r, shiny

With Christmas tomorrow we have decided to create an animated Christmas Tree using {ggplot2}, {sf} and {gganimate}.

First we need a tree. To do this we have used an {sf} polygon where we pass in the coordinates of the Christmas tree as a list matrix to st_polygon. We can then use geom_sf to add this layer onto a ggplot object.

library(ggplot2)
library(gganimate)
library(sf)
tree_coords =
  list(
    matrix(
      c(-4, 0, 
        -2.22, 2, 
        -3.5, 2, 
        -1.5, 4, 
        -2.5, 4, 
        -0.8, 6, 
        -1.5, 6, 
        0, 8, 
        1.5, 6,
        0.8, 6, 
        2.5, 4,
        1.5, 4,
        3.5, 2,
        2.22, 2,
        4, 0,
        -4, 0),
      ncol=2, byrow=T
    )
  ) 

tree = st_polygon(tree_coords)

gg_tree = ggplot() + 
  geom_sf(aes(), data=tree) 

gg_tree
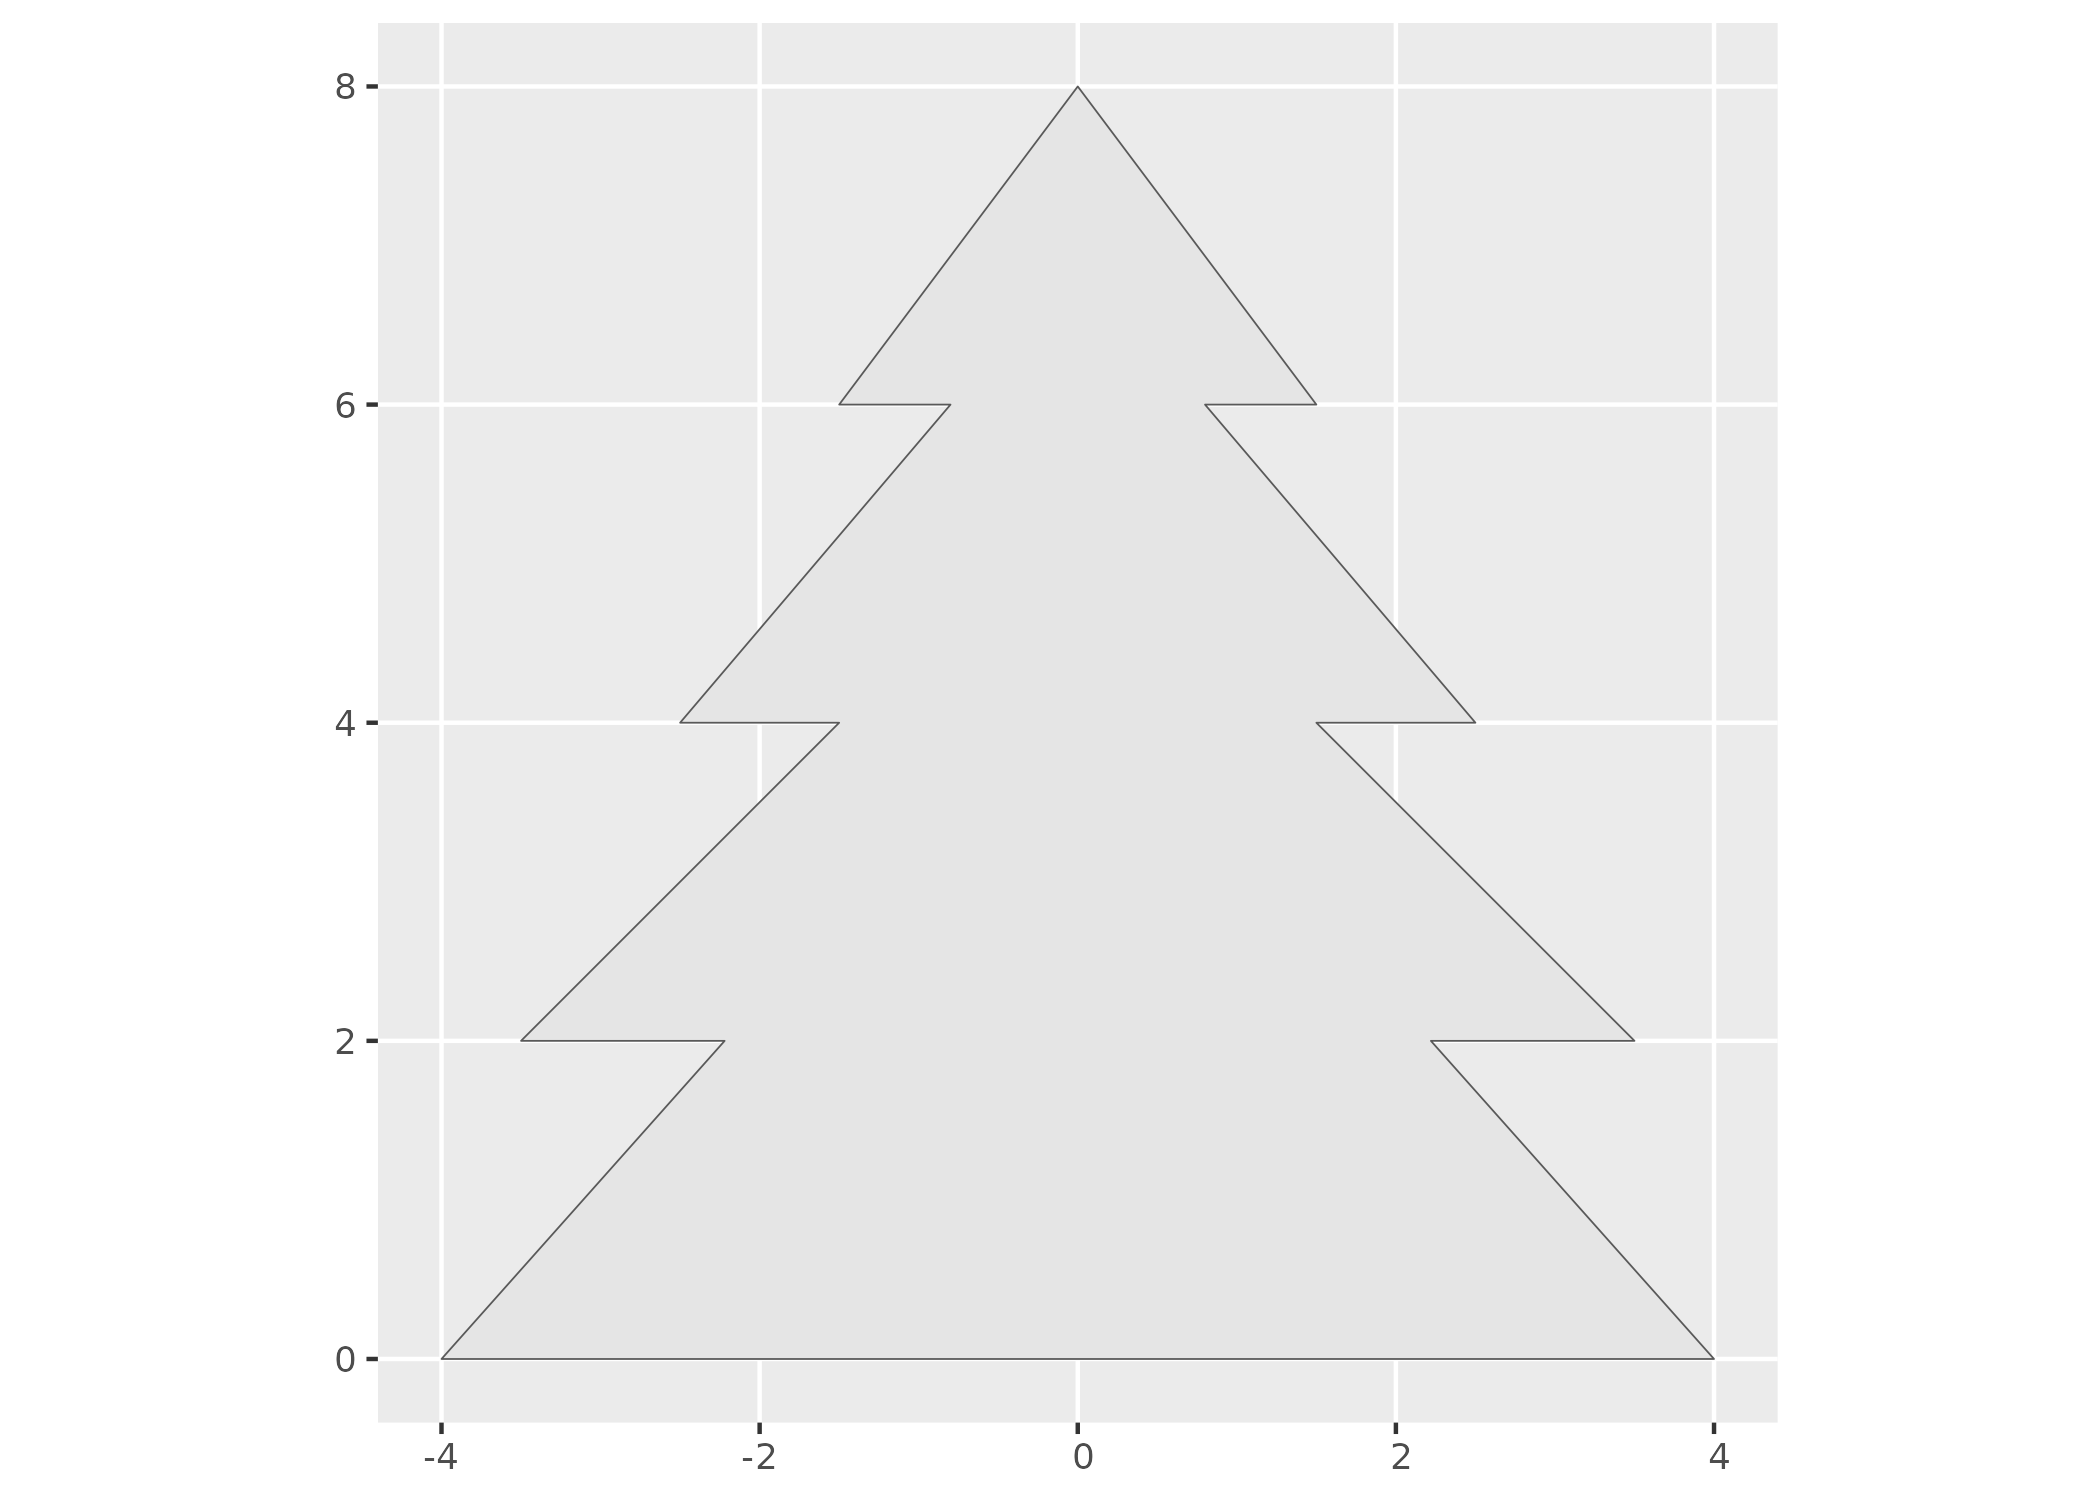
Christmas tree shape made with the sf and Ggplot2 R packages.

Okay, so now we have a tree shape. Now we need to make it a little more Christmassy by changing:

  • The color using: fill = "forestgreen", color = "darkgreen"
  • Adding the trunk: geom_rect(aes(xmin = -0.75, xmax = 0.75, ymin = -2, ymax = 0), fill = "saddlebrown", color = "sienna4")
  • Add a star on the top: geom_point(aes(x = 0, y = 8), color = "gold", shape = 8, size = 7, stroke = 3)
  • Remove the axis with: theme_void()
  • Set the border: coord_sf(xlim = c(-6, 6), ylim = c(-4, 10))
  • Add a Christmas message: annotate("text", x = 0, y = 9.5, label = "Merry Christmas \n From Jumping Rivers!", size = 6)

Now our tree looks like this:

gg_tree = ggplot() + 
  geom_sf(aes(), data=tree, fill = "forestgreen", color = "darkgreen") + 
  geom_rect(aes(xmin = -0.75, xmax = 0.75, ymin = -2, ymax = 0), fill = "saddlebrown", color = "sienna4") +
  geom_point(aes(x = 0, y = 8), color = "gold", shape = 8, size = 7, stroke = 3) +
  theme_void() +
  coord_sf(xlim = c(-6, 6), ylim = c(-4, 10)) +
  annotate("text", x = 0, y = 9.5, label = "Merry Christmas \n From Jumping Rivers!", size = 6) 

gg_tree

Green Christmas tree made with the Ggplot2 R package.

Next we need to use {sf} again to make some lights for the tree then {gganimate} to make the lights flash.

Placing the points within the boundaries of the tree was a trickier task than we expected until we fell upon st_sample which we can pass a polygon to and it’ll create some sample points within the boundaries. We also create a vector to colour the points.

points = st_sample(tree, 75)
colours = sample(c("red", "yellow", "blue"), 75, replace = TRUE)

gg_tree = ggplot() + 
  geom_sf(aes(), data=tree, fill = "forestgreen", color = "darkgreen") + 
  geom_sf(aes(), data=points, color = colours) +
  geom_rect(aes(xmin = -0.75, xmax = 0.75, ymin = -2, ymax = 0), fill = "saddlebrown", color = "sienna4") +
  geom_point(aes(x = 0, y = 8), color = "gold", shape = 8, size = 7, stroke = 3) +
  theme_void() +
  coord_sf(xlim = c(-6, 6), ylim = c(-4, 10)) +
  annotate("text", x = 0, y = 9.5, label = "Merry Christmas \n From Jumping Rivers!", size = 6) 
  
gg_tree

Christmas tree with lights made with the sf and Ggplot2 R packages.

We can now animate it to make the lights sparkle using transition_time and ease_aes:

gg_tree +
  transition_time(1:75) +
  ease_aes('linear')
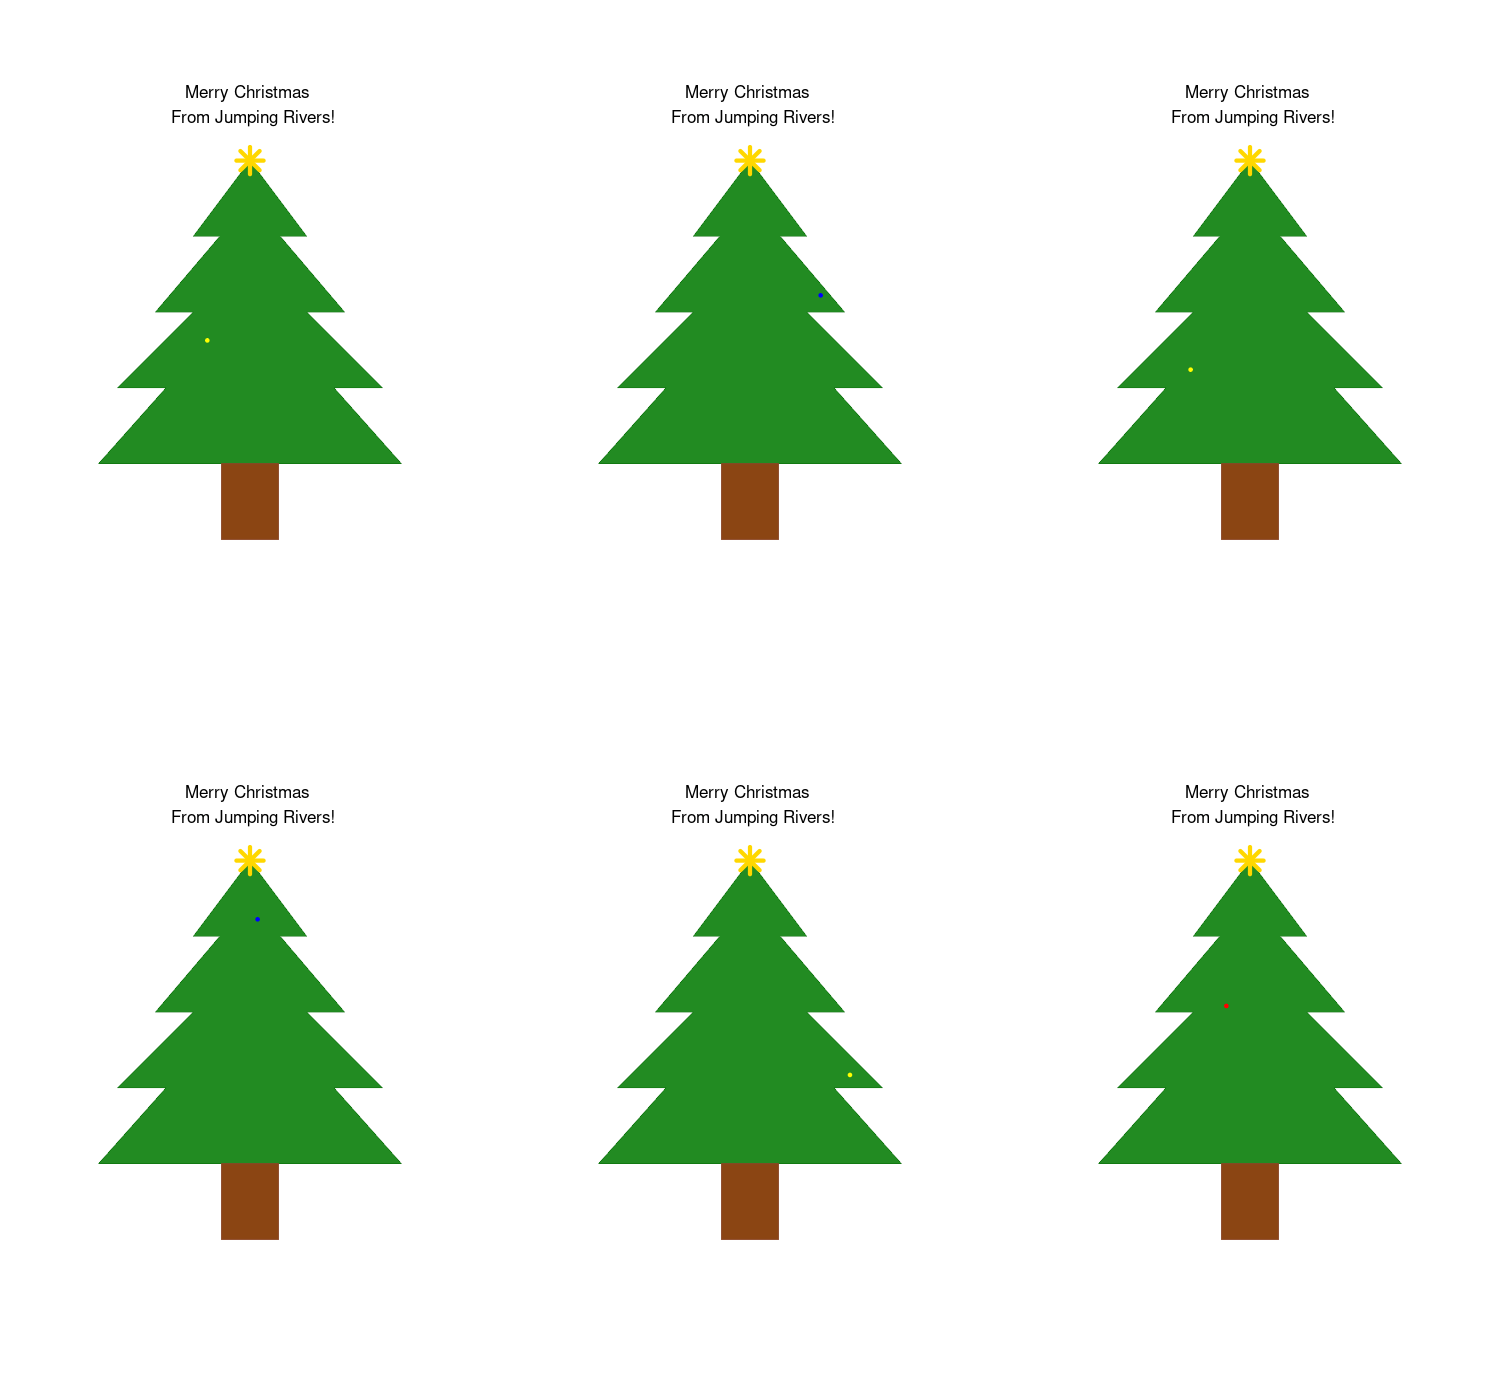
Final Christmas tree GIF with sparkling lights.

Lastly, have a great Christmas and New Year from the Jumping Rivers team!


Jumping Rivers Logo

You might also like

Online R and Python Training Courses: 2026 Schedule

A full schedule of online data science training courses is now available through to November 2026, covering R, Python, machine learning, statistical modelling, Shiny, and more. All sessions run online over six hours.

Accessibility in R applications: {shiny}

Web content accessibility is an important topic to consider when building web based applications. {shiny} is an excellent tool that allows data practitioners a relatively simple, quick approach to providing an intuitive user interface to their R code via a web application. Here we explore accessibility in the context of a {shiny} application.

Catch us at these conferences!

At Jumping Rivers we’re always to want to branch into the data science community, and so this year we’re going to quite a few conferences in the autumn. You can catch us at: GSS (Government Statistical Service) Conference - Edinburgh.

Recent Posts

  • Why learn the command-line interface? 
  • A First Look at Positron and Posit Assistant: Free Jumping Rivers Webinar 
  • Five pre-flight checks for your dashboard 
  • AI in Production Conference Summary (2026) 
  • AI in Production 2026 Speakers 
  • Ghost in the Shell Script 
  • Online Data Science Training Courses: R, Python, and Machine Learning in 2026 
  • What's new in R 4.6.0? 
  • Programming with LLMs in R & Python 
  • Using R to Teach R: Lessons for Software Development 

Top Tags

  • R (255) 
  • Rbloggers (199) 
  • Pybloggers (99) 
  • Python (99) 
  • Shiny (65) 
  • Machine Learning (31) 
  • Training (30) 
  • Events (29) 
  • Conferences (21) 
  • Tidyverse (17) 
  • Statistics (16) 
  • Packages (14) 

Keep Updated

Like data science? R? Python? Stan? Then you’ll love the Jumping Rivers newsletter. The perks of being part of the Jumping Rivers family are:

  • Be the first to know about our latest courses and conferences.
  • Get discounts on the latest courses.
  • Read news on the latest techniques with the Jumping Rivers blog.

We keep your data secure and will never share your details. By subscribing, you agree to our privacy policy.

Follow Us

  • GitHub
  • Bluesky
  • LinkedIn
  • YouTube
  • Eventbrite

Find Us

The Catalyst Newcastle Helix Newcastle, NE4 5TG
Get directions

Contact Us

  • hello@jumpingrivers.com
  • + 44(0) 191 432 4340

Newsletter

Sign up

Events

  • North East Data Scientists Meetup
  • Leeds Data Science Meetup
  • AI in Production
British Assessment Bureau, UKAS Certified logo for ISO 9001 - Quality management British Assessment Bureau, UKAS Certified logo for ISO 27001 - Information security management Cyber Essentials Certified Plus badge
  • Privacy Notice
  • |
  • Booking Terms

©2016 - present. Jumping Rivers Ltd